Three Ways to Organize System Information for a Better Test Plan

A typical performance test cycle can be divided into five phases: planning, creating scenarios, running scenarios, analyzing results, and tuning the system. But that first step, establishing an effective planning process, often gets ignored or is viewed as less important, which can result in a less comprehensive test cycle and lower-quality software.
Having a better way to organize system information can help your team see what information is available and form a more effective performance testing plan. Let’s look at three approaches.
1. Transaction Mix
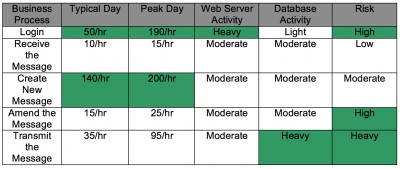
A transaction mix displays system usage information in terms of transactions, throughput, peak load times, web server activity, database interaction, legacy system interaction, and the level of risk if the transaction should malfunction.
Let’s consider a sample transaction mix diagram for a typical order management system:

The green cells represent potential candidates to be checked during performance testing. A diagram like this can help you come up with different scenarios for your systems to see where any problems may lie. One of the advantages of a well-captured transaction mix diagram is that it eliminates unwanted scenarios and test cases from the test pack, saving time and effort.
2. Task Distribution Diagram
A task distribution diagram displays system usage information in terms of transactions, throughput, and peak load times.
The diagram displays the throughput of all business processes relative to the timeline of a typical workday, but of course, there can be more than one peak load time depending on the season, accounting, or other factors. Therefore, it’s recommended to start performance testing by emulating a normal day’s throughput, then looking at the off-season or holiday load of the system and understanding the task distribution during that period.
3. User Profile
A user profile displays system usage information in terms of task frequency (throughput per hour) and the type and number of users.
Each application has a different set of users, with each user having specific roles to play. It’s important to keep in mind that the number of users will keep varying from one role to another.
Let’s consider an order management firm that has developed a web-based application for investors. At a very high level, the users for the application can be divided into three categories:
- Trader (Agent): 75 users
- Trader (Proprietary): 60 users
- Manager: 25 users

From the above table, we can see that the trader groups each have a large number of transactions from placing and amending trades. The manager user group contributes largely to reports transactions. An important bit of information provided by a user profile is the frequency of transactions performed by each user group. For example, the manager user group mainly concentrates on the day’s transactions with the help of the trade reports, which are normally collected after the end of the trading day.
Ensuring proper planning has a direct bearing on a piece of software’s performance. Implement the above three approaches to ensure more effect test planning in your performance testing efforts.

